

Economic Factors, Hedging, and Portfolio Performance
- Bob Korkie

- May 2, 2021
- 3 min read
Updated: Jun 5, 2021
Performance measurement is not just about realized returns and risks. An important attribute is the portfolio’s ability to hedge against economic factors that could adversely affect a portfolio’s return but may not in any particular analysis period.
The Factors
A portfolio manager/owner may have constructed a portfolio so that its performance is more or less sensitive to changes in specific economic variables/factors. For example, an owner who is exposed to mortgage rate increases may want a portfolio that has larger returns when medium- or long-term interest rates increase. A retiree with fixed pensions may want a portfolio that has larger returns when inflation increases and is averse to large equity portfolio losses. A frequent traveller outside the country may want a portfolio that has larger returns when the foreign exchange rate for other countries’ currencies becomes more costly. A worker who is exposed to job losses in economic recessions may want a portfolio that is not a loser if the unemployment rate increases. Retired persons may want a portfolio that has little exposure to the stock market and its large volatility.
In the current version of RoboPPA™, its internal database contains the following factors, with the intention to add others as market research suggests.
The inflation rate, measured by the consumer price index
Change in the short-term interest rate measured by the change in the Treasury bill yield
The level of medium-term interest rates, measured by the yield on mid-term Federal Gov’t bonds
The USD/CAD exchange rate (for CDN domiciled portfolios) or the Trade-Weighted USD Index (for US domiciled portfolios)
The unemployment rate
The stock market return
US stock market volatility measured by the VIX index
RoboPPA™ also provides an opinion on whether the portfolio’s return is significantly related to the factors, and also measures the aggressiveness of the portfolio to changes in only the stock market index, as measured by the portfolio’s beta and timing ability.
An Example
An actual, aggregated retirement portfolio was valued at $94,973 on Dec 31, 2015 and had numerous contributions and withdrawals over an analysis period ending February 28, 2021. After portfolio transfers and fees, the RoboPPA™ ending value was $307,313 or $324 per $100 of Dec 31, 2005 starting value. The IRR was 6.9%/year and the S&P500 IRR and ending value were 13.1%/year and $463.The reasons for the apparent poor performance are discussed subsequently but first the portfolio’s factor exposures.
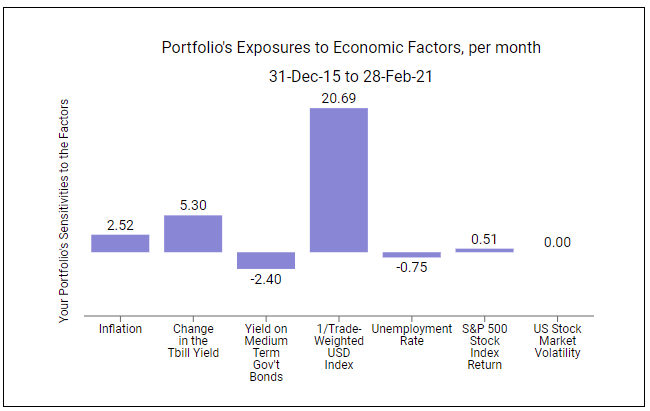
As shown in the preceding chart, RoboPPA™ estimated positive exposure to the S&P500 return, which is statistically significant. There was significant negative exposure to the unemployment rate and to the Gov’t bond yield. Probable positive exposure existed to the change in short term interest rates. Inflation, the trade-weighted foreign exchange rate, and US stock volatility were unrelated to the portfolio’s return. Thus, there was an undesirable negative hedge against unemployment and mortgage rate increases, and no hedge against inflation, the cost of travel, or large stock market volatility.
Overall, these exposures suggest that the portfolio does not provide protection against an economic downturn but seem more suited to a strong economy. Despite these exposures, the portfolio return was very low compared to the quite strong market performance of the S&P500; the question is why?
Conclusions
RoboPPA™ shows the aggregated portfolio with less volatility than the S&P500 and less tail risk, with much less return. This is likely due to the portfolio being much less aggressive (small beta = .1) relative to the up equity market. This suggests that there is a portfolio asset with low risk and very low return. Investigation of the portfolio’s monthly reports indeed showed that idle cash comprised more than 50% of the portfolio value at the end of the analysis period. This occurred simply due to lack of vigilance by the portfolio owner over the aggregated portfolio’s self-managed portfolios. The extreme cost of this mistake, unadjusted for risk, was the difference between the benchmark S&P500 end value ($463.15) and the portfolio’s end value ($324.24) equal to $138.91 per $100 of starting value, or $131,927 in total. This was a costly but easy fix for the portfolio owner.
A significant advantage of RoboPPA™ is that the required inputs for its performance analysis can be saved in its template and updated monthly. This can be done entirely on the user’s computer and never stored on the software’s servers. The software maintains the benchmark database thereby reducing the user’s work. Finally, the software allows analyses over any selected period contained in the data template’s horizon, providing it exceeds eight months.
Caveats
The analysis and the results in this document are not to be interpreted as representative of real markets and asset classes and are not warranted to be correct or complete. The example is based upon our opinion and interpretation of the data and results, which may be incomplete or incorrect. RoboPPA™ or the data suppliers are not responsible for any damages or losses arising from use of this blog. Details on the performance calculations are available on www.RoboPPA.com.
Comments